If you have ever read or heard a mutual fund advertisement in print or radio or TV, the final words are – “Please read the scheme information document carefully before investing.”
In reality, very few actually do it. That does not take away the fact that the best way to understand a fund is to read various documents associated with it.
Unfortunately, the fund industry has done its best to confuse the investor in every way possible. The information is strewn across so many documents including a Scheme Information Document (SID), a Key Information Memorandum (KIM) and a Factsheet.
And worse, there is no standard format for them. So, if you take scheme documents of two funds, you would feel that they have come from two different planets.
Just search documents for any two funds on the Internet and you will know what I mean.
As an investor, the most important information that you should be looking for is available in the fund factsheet.
Welcome – Mutual Fund Factsheet
What does the fund factsheet tell you? Let’s take this up with an example.
We will consider an actively managed equity mutual fund (that is not an index fund). The Franklin India Bluechip Fund (FIBF) should be a good one.
For your reference, click here to download the factsheet of Franklin India Bluechip fund.
OR
Click here to read the Fund CV online on Unovest
Here are the key parts of a mutual fund factsheet.
Basic Information in fund factsheet
#1. Scheme Name – Typically, this one gives you the quickest view on what the fund is. However, given the variety of names that are out there, it can also end up being equally confusing. Any reason we have 3000 + scheme names? Yeah!
FIBF, as the name suggests, is a fund that will invest in bluechip or large size, stable companies.
To understand this better, the name Franklin India Flexicap Fund, on the other hand, would suggest that the fund will not restrict itself to any market cap and freely take up opportunities available across the spectrum.
A name like Sundaram Select Midcap Fund would invest in midcap stocks.
#2. Nature of Scheme – The nature of scheme tells you if it is an open-ended scheme or a closed ended scheme. In a closed ended-scheme, you cannot buy units other than in the initial subscription period. The sell or redemption option is also available in certain intervals and not every business day.
FIBF is an open-ended scheme, that is, one can buy and sell the units of the fund on any business day.
#3. Scheme Objective – This is a brief summary of what the scheme intends to do.
In case of FIBF it “is an open end growth scheme with an objective to primarily provide medium to long term capital appreciation.”
Yes, I know, it does not make a lot of sense or give away any insight in particular. But that is what it is. In fact, long term capital appreciation is a standard phrase in almost all equity scheme objectives.
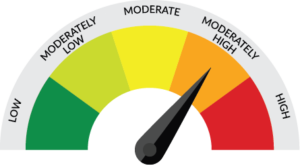
#4. Riskometer and Scheme Suitability – The riskometer tells you as to how much ‘risk’ your investment is likely to be at. Most equity funds will fall into Moderately High and High Risk profiles.
The risk is to be understood as that the equity investments can be very volatile and there can be extended periods when there would be no increase in value. If you are ready to brace that volatility, you are ready to invest in an equity fund.
The scheme suitability is a guideline which indicates the kind of investor the scheme is meant for.
FIBF has categorised itself into a moderately high risk scheme. On suitability, it says that the fund is suitable for those who are looking at long term capital appreciation in a fund that invests in large cap stocks.
#5. Inception date – This is the date when the scheme started its investment activity. It also goes to suggest the age of the scheme. A scheme with a higher age means a longer track record and more experience under the belt, which is a plus point.
The inception date of FIBF is December 1993. That’s a 22-year track record covering various bull and bear phases of the market.
#6. Benchmark – The fund schemes benchmark themselves against a market index. The choice of the index benchmark helps understand what kind of a stock selection strategy a scheme is likely to follow.
The benchmark for FIBF is S&P BSE Sensex. BSE Sensex consists of some of the largest companies in the Indian stock market. This further affirms the idea that the fund is likely to invest in large cap stocks.
#7. Fund Manager – While most fund houses would profess to be governed by processes and not on individual whims, fund managers do tend to influence the investment style of a fund. It is not easy to discount away the fund manager experience. It does matter.
A good fund manager help create a strategy that can deliver better risk adjusted returns for the fund scheme within the mandate.
However, a fund that delivers only because of the presence of a particular fund manager is unlikely to sustain its performance in the long term.
FIBF’s current fund managers are Anand Radhakrishnan and Anand Vasudevan.
Portfolio Strategy in fund factsheet
#8. Investment Style – The investment style is a sneak peek into how the fund will go about identifying its universe and making its stock selection. It may also specify if the fund will have a limit to the number of stocks it will have in the portfolio and the allocation range for any one stock. This will define the diversification strategy of the scheme.
FIBF investment style statement says, “The fund manager seeks steady and consistent growth by focusing on well established, large size companies.”
#9. Portfolio holdings (stocks/sectors) – The current holdings of the fund in terms of stocks and sectors give you an idea of where the fund is invested and whether it is in line with the objective and style it has identified for itself.
You may see Top 10 stocks and sectors in some cases, while other fund factsheets would present the entire portfolio.
FIBF has 42 stocks in its portfolio – which means that the portfolio is quite diversified. Only 2 stocks – HDFC Bank and Infosys, are over 5% in allocation. (It has also star marked its top 10 holdings).
In term of sectors, banks and software have the maximum allocation in the fund.
#10. Turnover – The turnover of the portfolio suggests how often the fund makes changes to its portfolio in terms of buying and selling stocks/securities. As a general rule, the lesser it is, the better. Higher turnover means more expenses on the fund thus affecting the returns. Not something that you would want as an investor.
FIBFs turnover, as per the fact sheet is, 17.07%. That means that on an average a stock stays for about 6 years in the portfolio.
#11. Past performance – Past performance is considered the holy grail of fund selection. Most investors make their investment decisions based on this one factor. This may not be correct. At least, past performance is not the only thing that one should look at.
What we have discussed above under portfolio strategy and various ratios deserve more attention than past performance.
When it comes to performance, funds typically show the value of Rs. 10,000 invested lump sum and an SIP over a period of time.
The same calculation is also done for the benchmark to help understand how the fund fared vis-à-vis the benchmark. This would help reveal if you made a great decision in choosing this fund or you would have been better off investing in another fund or an index fund?
FIBF shows SIP returns for 1, 3, 5, 7, 10 years and since inception for itself as well as against two benchmarks. It appears that it has outperformed the benchmarks over all time frames.
Though it is not clear, whether the benchmarks have been considered with only price returns or total returns (including dividend).
Volatility Measures in fund factsheet
The volatility measures pertain to ratios such as Standard Deviation and Sharpe Ratio. These measures could again be different numbers depending upon where you are looking. This is because of the difference in the time periods.
In case of FIBF, data over a period of 3 years has been used for the calculation of these ratios.
#12. Standard Deviation – Standard deviation tells you how much of a yo-yo the fund returns have been. It means how far have the returns of the fund deviated from its average over a period of time. More the deviation, more volatile the fund is.
FIBF has a standard deviation of 4%, which means that it has been fairly stable.
#13. Sharpe Ratio – The Sharpe Ratio is a measure of how much additional return the fund has delivered for every additional unit of risk taken. It is calculated as
= (Return of the fund – Risk free rate of return*) / Standard Deviation
In case of FIBF, the Sharpe Ratio is 0.29.
*Risk free rate is, for example, the 10 year Government Bond rate.
Some other funds factsheet can share more data including that on Beta, P/E ratio of portfolio, P/B ratio, Market capitalisation of the individual holdings, etc.
Most of these ratios would be better understood when you compare them with similar other funds.
Charges
#14. Expense Ratio – The expense ratio is the fee charged for running the show. It is a sum of all expenses that the fund charges including Investment management fee (plus service tax), sales and distribution costs, brokerages, custodians, etc.
In case of FIBF, it has an expense ratio of 2.24% for its regular plan while the expense ratio of direct plan is 1.41%.
Direct plan expenses are always lower because they do not have sales and distribution costs.
#15. Exit Load – If you decide to redeem or sell your units before a specified time period, you may have to bear a charge. Exit loads are typically created to prevent early redemption by investor. This charged is levied on the sale value or redemption value of the investment.
For FIBF, if you redeem your investments in less than 1 year of purchase, you will be charged a 1% exit load on the market value.
So, that’s what a fund factsheet tells you. This is not an exhaustive list. As mentioned before, there can be several other information that can be showcased by different funds.
As an investor, it is highly likely that you might feel overwhelmed with the information. The recommendation is don’t avoid it. Start with the fund factsheet and then you can go deeper with the Scheme Information Document. Use it to ask more questions of a fund.
Know and understand your fund in advance before you make your investment and it will prevent a lot of heart burn later.
Click here to read the fund CV of Franklin India Bluechip Fund on Unovest.
Further reading: Top 10 Mutual Funds – Facts that you probably didn’t know


[…] you should look at the scheme fact sheets which are available on the respective websites of these funds. For an initial filtering you can use […]