So, you want to invest in mutual funds.
What do you do?
Go to your favourite mutual fund data aggregator portal’s and then the comparison page. You specify various parameters and get a shortlist, which you can further research.
Read more, look at the factsheets (really!), past returns, expense ratio, fund manager, size and what other people are saying.
You compare funds and reduce your shortlist based on available data.
Finally, select a bunch of funds, go ahead and invest. Done.
Perfect!
I don’t think so.
I have been studying mutual funds for over 10 years now and for most of the earlier part of that period, I did the same.
I realised the problem with this approach of relying on “as on date” data points than trends. You too will know as you read on.
When you are doing your research on which funds to buy in, you are only looking at data made available to you. You are unlikely to do the hard work to go beyond what is present and look at some of the past factsheets to know how the fund’s personality has evolved.
Take a simple example of past returns. Across portals you see only point to point returns data for 1, 3 and 5 years. That is, the annualised returns assuming you invested a lump sum amount or did an SIP for Rs. 10,000 in the fund scheme.
For all other ratios too, you get to see one number, as on the date of the last report. If I am in Sept 2017, I get to see expense ratio as of the last month that is Aug 2017.
The Sharpe Ratio, Standard Deviation or Turnover too is as calculated as of the past month aggregated by the portal you are looking at.
Forget the portals, even the fund factsheets issued by various mutual fund houses for the respective schemes show only as on date data points, be it past returns or other risk ratios.
Then there is a question of interpretation of facts and resulting views/opinion on these facts.
Let’s take an example of interpretation.
MorningStar, one of the well known portals for mutual fund info and data, has categorised HDFC Equity Fund as a Large Cap fund.
On the other hand, ValueResearch, the other aggregator, categorises the fund as a Multicap / Flexicap fund.
The HDFC Equity fund factsheet (Aug 2017) issued by HDFC Mutual Fund doesn’t say anything. Even the scheme objective is vague, “to achieve capital appreciation”.
Ideally, the fund is categorised based on how it plans to access investment opportunities. Will it focus on a specific market segment or go across the market?
It is a difficult to find out this information. If at all, the Scheme Information Document may throw some light on it. An easier way to understand it is to look at the scheme’s stated benchmark.
In this case, HDFC Equity Fund‘s stated benchmark is Nifty 500. Nifty 500 is a broader market index covering more than 90% of market’s breadth. Given this, the fund should be categorised as a multicap / flexicap fund.
If the benchmark is BSE Sensex of Nifty 50, the fund is likely to be a large cap fund.
As an investor, if you happen to believe that HDFC Equity Fund is a large cap fund, then you start comparing it with its peers in the large cap space. Will that be correct? I don’t think so.
Let’s take the various ratios.
As a fund accumulates experience over time, it is important to know the features of that experience. Data points over a period of time, or trends, make this understanding more informed.
The fund houses should display the trends over time about a particular fund scheme.
For example, I would like to know the trend for turnover and expense ratios of HDFC Equity Fund.
I am unlikely to find this information as ready to consume.
If at all, I need to plot the data points after looking at various past factsheets and then get the trend view – like I have done below.
Chart: HDFC Equity Fund – Expense vs Turnover
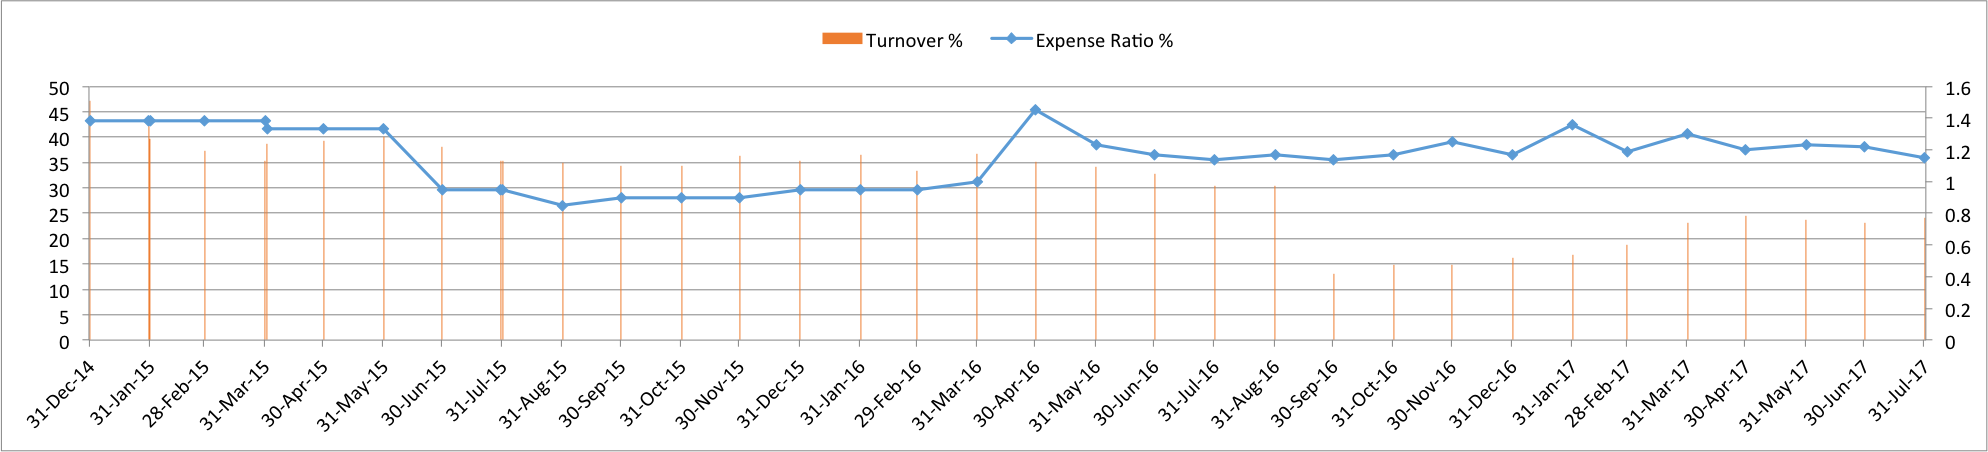
Source: Unovest Research, Data from December 2014 to July 2017, Direct plan only
As you can see, a trend offers a much better understanding than a standalone data point for “as on x” date.
Not just that, can I see the change in expense ratio against the AUM growth? This will help me understand if the fund has been passing on the benefit of AUM growth to investors via a reduction in the expense ratio.
I would also like to see a comparison of number of stocks held by the fund scheme over the past 12 quarters.
This could help me see if the fund is just doing closet indexing or is really applying insights to have a more focused portfolio. If there are large number of stocks – as much as the benchmark – then closet indexing is more likely to happen.
For past performance data, I need to look at rolling returns and not just point to point returns. Rolling returns too is a like a trend of performance than just data as an a particular date. Read more here on why rolling return comparison is better.
I also want to see the “the skin in the game“, bold and highlighted. The fund house should prominently display in its factsheet the % of AUM held by its fund managers. Does the cook eat his own cooking? Yes, I know some funds do it, but not all. Again a trend line is better.
Is getting this data and doing a comparison of mutual funds difficult?
Yes and no!
The individual investor will find it quite difficult. The only way to do this kind of analysis by an investor today is to look at various factsheets from the past, collate the data in one place and then run the analysis via charts, graphs or other formulae. An alternative is to buy expensive analytical software and spend time and effort for the same. The cost vs benefit may not be worth it.
For the fund house, it is not difficult at all. All the data resides on its computers. It has to just allow the investor to access its website and see this data in the above formats.
For the aggregator mutual fund info websites too, this should be easy. In fact, they can go a step ahead and present this information in a comparative way across fund houses and not limited to a particular fund house. For example, an HDFC Equity Fund’s trend data can be compared with Franklin India Prima Plus.
I hope this is not asking for a lot. There are signs of some fund houses taking a stance on the way they present the information about their fund schemes, but there is a long way to go.
Till that happens, there is lot more work to be done by individual investors to compare mutual funds and find out which ones deserve their money.
Would you like to see this information all in one place at Unovest? Do let me know in the comments box. Speak your mind.


Would you like to see this information all in one place at Unovest? Yes . I am very much interested to know :-).
Most of the people thinks that comparison means ,its only by returns what the fund produces.
No one cares to read fund fact-sheets, Now you have shown me different perspective of parameters for comparison,
Thanks for introducing these new areas to explore for comparing 2 funds.
As an investor , i am expected to click single button called Compare and the website should do all background work and bring me the results. ( Forgive me i am too greedy /Lazy to get in one click 🙂 ).
Do you have any plans to bring this kind of feature in Unovest.
Nice to know that Vandhi.
Well, we would love to share this info with our customers. Working on it.
Thanks
An eye opener! With too much information available on mutual funds, it is really difficult to know the basis to compare mutual funds. I guess, best is to hire an advisor 😉