Warning: Markets are unpredictable, period. This post is about trying to understand what might be the market telling us now. Using that information, maybe, to make some asset allocation decisions.
It is not unusual for me to get calls / messages asking if the markets is overvalued and we should take money out from equities. Honestly, I get jittery with that question.
Standalone, there is never a good answer to it. Since I know who I am talking to, I do give a contextual response.
However, after a recent call, I started thinking if there can be a more objective, methodical way to understand where the markets are and give a more strategic view to an investor.
I emphasise strategic because a lot of existing frameworks or models have been created for traders or short term participants.
A long term investor needs a different kind of framework – a more fundamental approach and definitely a simple one to guide his/her asset allocation.
Taking an objective market view
I started working with interest rates on 10 year Government Securities. Interest rates have a deep fundamental impact on an economy and thus investing.
When interest rates are high, investors prefer bonds as they pay well with minimal risk. The high interest rates also act as a dampener for equities, since the cost of capital is higher for businesses.
Rising / high interest rates also mean that inflation is on the high and consumers may not be keen to spend money leading to a vicious cycle of a downtrend in the economy further hurting investor returns.
When interest rates are low, investors shun bonds and start moving towards equities. The low interest rates allow businesses to borrow and invest in growth (hopefully).
Lower interest rates also lead to higher valuations for businesses which gets reflected in rising stock market prices. If it is backed by actual, real economic and business growth, it becomes a golden period.
So, quite simple, right!
Invest more when interest rates are low or falling and in bonds when they are high or rising.
If we look at the current interest rates scenario, they are low, like really low in the past few years. So, should you go all out, sell your house and invest?
MindVoice: What if the interest rates are low but the stock valuations are in the stratosphere?
There is no easy answer here..
I think interest rates alone may not work. We need to bring in the valuation levels for stocks as well.
Let’s add another indicator, the PE ratio or the Price – Earnings ratio. It is a measure of valuations or how expensive a stock or the market index in general is.
I take the Nifty 200 PE (instead of the popular Nifty 50) as it represents a broader market. Most of the quality stocks reside there. It is also more representative of investor portfolios in general.
Now, I have 2 variables – 10 year G Sec rate and the Nifty 200 PE – to get me an answer. Let’s get them talking.
The Model
That’s where a model comes in. Here’s how I did it.
- Take monthly 10 year G-Sec rates (courtesy Investing.com) and Nifty 200 PE ratios (courtesy NSEindia.com) from 2014 onwards.
- Calculate 3 year rolling percentile rank for each
- With equal weightage to both ranks, calculate a single score.
Sounds pretty simple. Well, I am definitely not in favour of complex.
We run the model and here’s what we get.

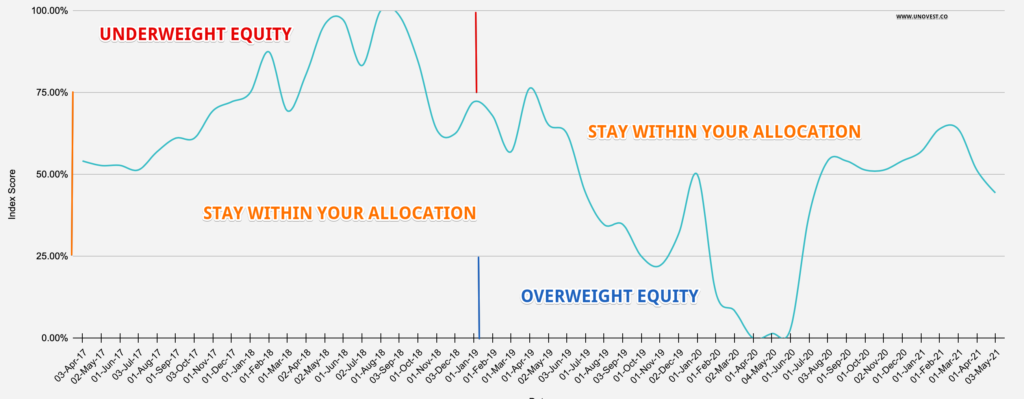
The chart plots the model scores from April 2017 (beginning) to May 2021(beginning).
What is it telling us?
So, now the model does help us see those edge cases, which is what we set out to find in the beginning.
Here are the 2 edge cases that can be identified in the time period of the above model.
- When interest rates are relatively high and valuations are relatively high too, it is better to be underweight equities. This was apparently the case in most of the calendar year 2018.
- When both interest rates and valuations are relatively low, adding more to equities can be beneficial. This was true for April / May 2020.
That’s interesting!
Apart from the edge cases, the answer is a simple one. Stay with your asset allocation! It is boring but one you can rely on for most periods.
Now, the model is far from perfect. For example, the model above also suggests overweight equity in Feb and March 2020.
If you are not the adventurous type, you can forget any model (including the one above) and stay put with your regular asset allocation – 60:40 or 50:50, whatever that might be.
Yes, some extra guidance is helpful and the chart based on the model can be of aid there. But don’t try to go overboard and win with the edge cases. Very few can!
That, my friend, is the simple answer.
Between you and me: I plan to fine tune this model and see if it can be an additional guide in the investing journey.
Do you find any use for such market models to guide your investing decisions? Do chime in with your comments.


Thanks for Article Vipin.
Another simple indicator, if any of SIPs ( assuming you have decent ones if not table toppers) running from 3 to 5 years or more , show negative return , then go ahead and invest more.
Regards, Aravind
Interesting!
This is great analysis for a layman. Very high class and rationally put.
I love the way you summarized in the end.
Keep going and more power to you!
Thanks Ankur. Glad you found it helpful.
Hi Vipin,
Really good analysis and simple way to put across the rationale.
I need to backtest this data since avialable historical data (preferably since 2000), but problem for me is I couldnt understand how did you derived a particular score. (Point 2 & 3). Can you help me for the said purpose.
If you can share the formula / excel file it will be really useful.
Regards,
Apurva
HI Apurva
Here is how the model works:
Take monthly 10 year G-Sec rates (courtesy Investing.com) and Nifty 200 PE ratios (courtesy https://www1.nseindia.com/products/content/equities/indices/historical_pepb.htm) from 2006 (April 1 is inception date) onwards.
Calculate 3 year rolling percentile rank for each
Calculate a single score with equal weightage to both percentile ranks.
Hope this helps.