Markets are random. The sequence of returns can be anything but certain. If we incorporate this understanding, we can suddenly see a range of scenarios emerging in how our investments are likely to deliver for us.
Will this insight be helpful? I think so.
We like to see that 12%, 15% or 20% return number associated with equity, however, this never happens in a straight line. The sequence of year on year equity returns can be very discomforting, plunging in one year and soaring in another. Both are extremes but they are likely to happen. You may be witnessing it already.
Hence, any attempt to calculate feasibility of your financial goals or your future net worth or how you will reach your goal with a straight line number may be misleading.
Now, let’s take up a case and see how the random nature of markets can take us on a roller coaster ride.
Abhishek is a dear friend who has been keen to know how his investments are going to look like in the future. I told him that there is no one right answer. It is somewhere between a range. It is best to look at the various possibilities himself.
We used an excel model to calculate the real net worth of Abhishek. He is 35 years old, earning Rs. 15 lakhs a year. He expects his income to grow by an average of 5% every year.
For the purpose of this project, he has agreed to use a saving factor of “equal to age”. So, at age 35, he will save 35% of his income, at age 40, the savings rate will be 40%.
Further, the low risk or fixed income investments too will be equal to his age at any given time. At age 35, not more than 35% should be in fixed income. Equity will form 65% of the portfolio. At age 50, equity will have 50% allocation in the portfolio.
Finally, Abhishek is working with a 11% average equity return and a 7.5% fixed income return. He is interested in seeing his real net worth, post inflation and not just an absolute nominal number. That is why, he has also input a 7% inflation.
Download the Real Net Worth and Random Markets Model
We now input these assumptions into the above excel model. You should download the file too and do the same.
Here’s what I see.
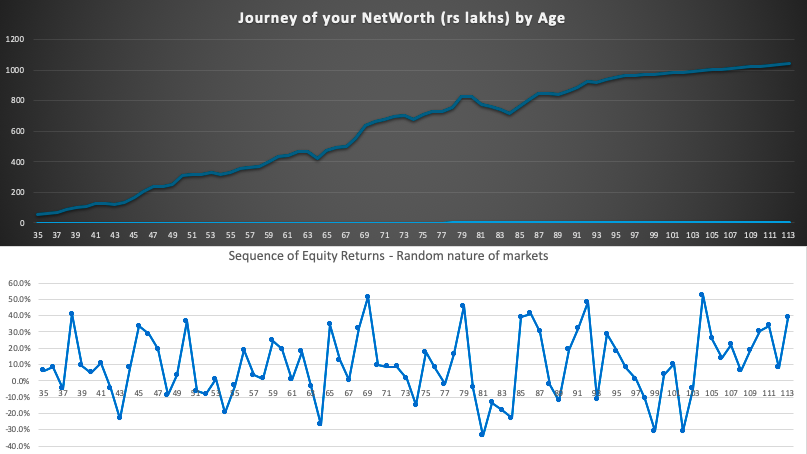
You shouldn’t be surprised if you see something different. Why? Because the model uses the base 11% equity return and then creates a random sequence of returns. The randomness is at play and hence you see a different sequence every time you save the file or make a change. There is no randomness in fixed income returns.
Once you have entered your assumptions, just keep pressing Ctrl / Command + S, you will witness a different sequence of returns at work and hence a different Real Net Worth outcome.
Here’s one more scenario.
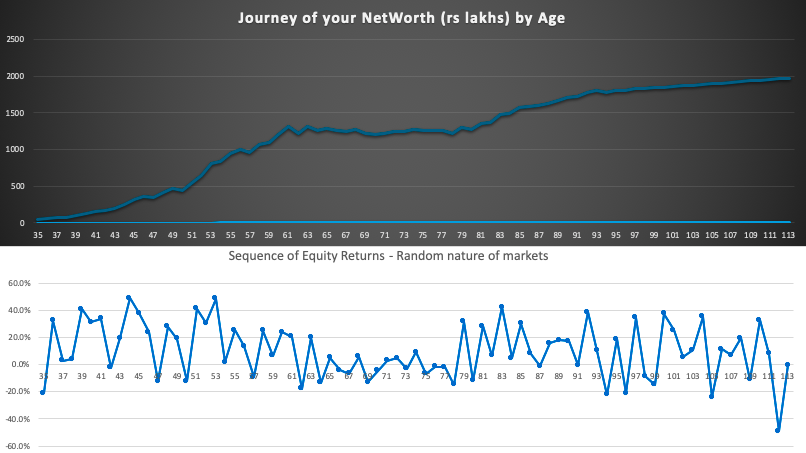
The sequence of returns feels quite real. They go up and down and based on when they go up or down, it can somewhat impact what the value of our investments will be and will they be sufficient to meet our future goals.
Why don’t you try out this for yourself? Remember, you have to input in the yellow coloured cells only. Some pointers below.
If you input inflation as “0”, the net worth number will be calculate as a nominal amount.
The “save till age” is by when would you like to save for your goal. You can say for “financial freedom”, I will save till 45 or 55 age.
You may leave the life expectancy number unchanged for now. It will be used in a further iteration of this model.
You can allow the model to use its automatic “save your age” formula. If you have a different number in mind, input that. It will be the same across the time period.
Your current portfolio value is the value of your investments that you have already saved for the said goal or the overall net worth as of today.
Done?
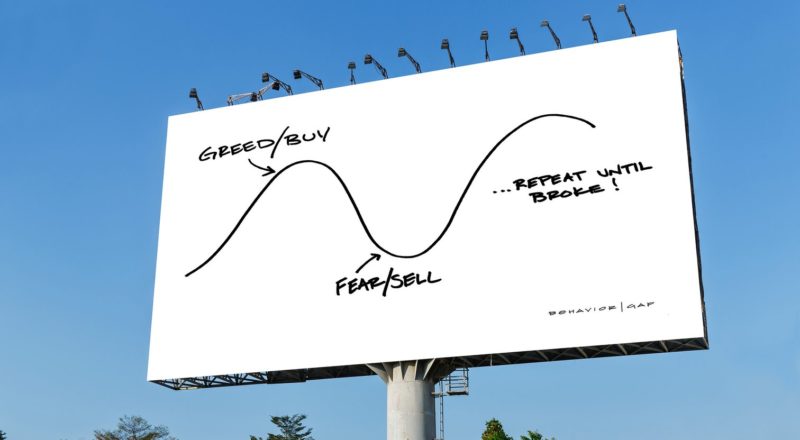
Do you see the randomness? This should give you a fairly good idea of the likely path your investments are going to take. Hopefully, it also helps you understand that any time period in your investments journey is meant to be. Panic and action resulting from there are not going to serve you well.
Get ready for the joy ride!



Leave a Reply