SBI Bluechip fund has been one of the most popular funds in the last few years. The numbers provide a clear proof. From an AUM size of just Rs. 740 crores in December 2013, it is now a behemoth at Rs. 15,236 crores (as of July 2017).
So, there was this little fund that started in Feb 2006, which saw a turnaround in performance with its new fund manager Sohini Andani. She started to manage the fund in Sept 2010, about 7 years ago.
Now a lot of water has flown under the bridge since then.
Winning performance brings the winner’s curse too. It is clearly reflected in the size of the fund as well as the resulting averaging of the performance.
The difference in performance over 5 and 10 years is telling. See the image below.
Source: Unovest. Regular plan, point to point annualized returns for a lumpsum amount invested.
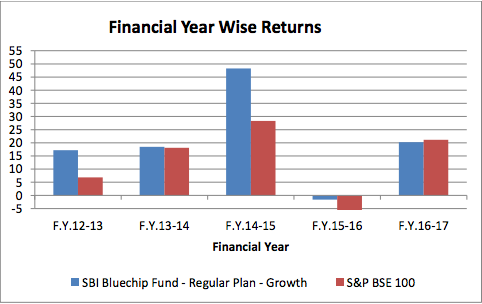
Let’s look at little deeper. Here’s a chart of the financial year wise returns of SBI Bluechip fund.
Source: Fund SID. The benchmark returns are only price based and not total returns index.
The fund clearly had a massive outlier performance in FY 2012-13 and FY 2014-15, which made it a darling of star ratings and rankings and all the investors who follow the same. So far, so good.
But is the tide turning now?
As the size goes up, the fund is going to be pressed to find the relevant opportunities in the limited space it has defined for itself. And of course, there is too are too many competing funds in the same space.
It’s a matter of time that the fund either faces mean reversion or opens itself to the entire market cap.
Other facts about SBI Bluechip fund
SBI Bluechip Fund’s investment objective states that it will invest in
opportunities for long-term growth in capital through an active management of investments in a diversified basket of equity/stocks of companies whose market capitalization is at least equal to or more than the least market capitalised stock of BSE 100 Index.
A couple of things to understand here.
First, the BSE 100 is the benchmark of the fund. BSE 100 is typically the largest 100 companies by market capitalisation traded on BSE.
BSE 100 is a index created by S&P and BSE with certain parameters. Read more on BSE website here.
Second, the fund says that it will invest in any stock that has a market capitalisation more than or equal to the lowest capitalised stock in the BSE 100 index.
What this means is that the fund can invest in a stock that is not a part of the BSE 100.
So, you can expect that while the fund predominantly invests in large cap, bluechip stocks it will not shy away from adding some midcaps too. SBI Bluechip Fund is not a pure large cap fund.
That brings us to the asset allocation of the fund.
In fact, if you look at the current equity asset allocation of the fund, about 70% of the portfolio is in large caps and the rest in mid caps and small caps.
The fund also holds cash when it feels the need to do so and has been doing it consistently over the last 5 years or so. Currently, the fund has about 11% cash in its portfolio.
Is the fund manger expecting a market correction so that more reasonably priced opportunities are available? Maybe.
The big question mark is the Portfolio Turnover Ratio of the fund.
For your reference, portfolio turnover = Lower of total purchases or sales in the reference period (divided by) Average AUM for that period.
The fund’s portfolio turnover ratio has been in the range of from 76% to 100+% over the years. This points to too much activity.
The fund is also making the most of its success. The fund house is relying solely on the one fund to shore up its financial health.
The expense ratio of the direct plan of the fund doubled from 0.57% in March 2016 to 1.07% currently.
Well, no one is cribbing for now!
To know more about SBI Bluechip Fund and compare it with its peers, click here.
What’s your take on the SBI Bluechip Fund? Are you a happy investor? Let us know in the comments space.


Leave a Reply