As an investor, you choose mutual funds to earn a higher return than your other traditional investments. You expectation is based on the past returns of these funds and you hope to get the same result for yourself. Is that the right way to go about it?
Let’s try and use a data based approach to determine these expectations.
So, what returns do you expect from your mutual funds?
10%?
15%?
20%?
Actually, it depends on what kind of a mutual fund you invest in.
- Equity & Equity Oriented
- Debt / Fixed Income
- Hybrid – a mix of both
A pure (diversified) equity fund is expected to give returns in line with the long term average GDP growth rate over the years.
A debt fund is expected to give returns in line with average historical interest rates and inflation.
With a mix of both, you can use simple arithmetic to derive a weighted average return.
Let’s see what data has to say in support of this argument.
How much returns to expect from equity?
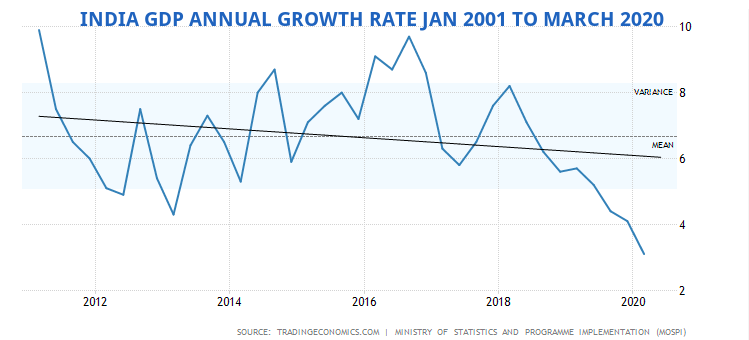
GDP Annual Growth Rate in India averaged around 6% from JAN 2001 MAR 2020. Note that the GDP fell around 23% in Apr – June 2020.
GDP growth rate chart in the 21st century

GDP or Gross Domestic Product is a good representative of the growth in the country – of all the value delivered by various entities which are a part of the economy.
Over a significant period of time, even the stock market growth aligns to the GDP growth rate.
Hence, as a thumb rule, we can approximate the growth in GDP as the expected portfolio growth rate. Let’s see how that works out.
Based on the above chart, we can expect 6% real GDP growth over the next decade or so. However, that is the real GDP. We need to add the inflation to bring it to the nominal level.
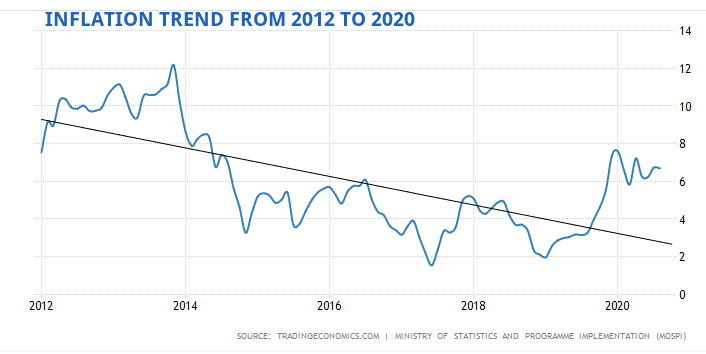
Inflation Rate in India averaged 6% from 2012 until 2020.

To raise GDP to a nominal level, add the inflation rate of 6% to the GDP growth rates of 6%. Thus nominal GDP is expected to grow at 12% for the next 10 years or so.
This is the same number that should reflect in a diversified portfolio of stocks representing various businesses, akin to an index fund.
You may want to assign some premium for finding good companies and better management of your own portfolio / behaviour, say around 2%. That gives you a range of 12% on the lower side to 14% on the higher side.
Does this rationale make sense?
Returns from Debt / Fixed Income investments
Estimating returns from debt / bond investments is far more complex. There are many variables that influence interest rates and thus the returns from debt instruments.
Usually, inflation and interest rates tend to be in sync.
We saw the inflation growth chart above and the average was around 6%.
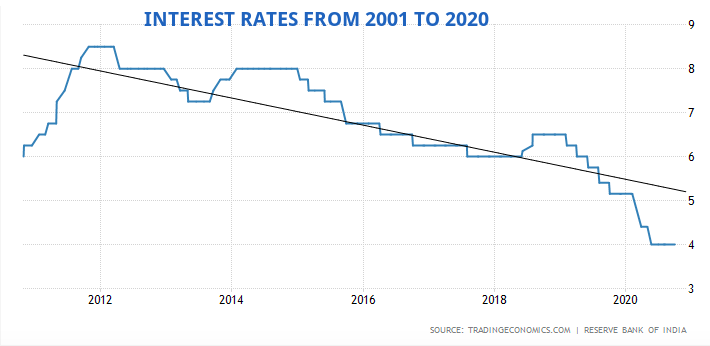
Interest Rate in India averaged around 6% from 2000 until 2020, reaching an all time high of 14.50% in Aug 2000 and a record low of 4.25% in Apr 2009.

So, we can expect a return of 5% to 6% on an average for our debt or bond investments.
Short tenure bonds will yield a lower rate and longer tenure bonds or funds will tend towards the higher side of the range.
Also, safer the bonds, lower the returns. NEVER forget that.
What will be the portfolio returns that has a mix of equity and debt?
We now have 12% expected returns on one side from equity and 6% expected returns on the other side from debt/bonds.
If you invest 50:50 in each of these, your weighted average returns is expected to be (0.5 * 12%) + (0.5 * 6%) = 9%, before taxes.
If you invest in the ratio of 80:20 for equity:debt, then your expected weighted average return would be (0.8 * 12%) + (0.2 * 6%) = 10.8%, before taxes.
How to calculate the return of your portfolio?
Here’s a quick way to calculate the returns of your portfolio.
- List down your own investments in various investments including EPF, PPF, NPS, Traditional insurance, Stocks, Mutual Funds, etc.
- Then list the allocation of debt and equity in each of the investments. For example, your NPS may have a 50:50 allocation to debt and equity.
- List down the expected return from each. This is because, in some cases, such as traditional insurance, the debt may also end up providing a much lower return.
- Multiply the weight or % allocation of the investment with the expected returns.
- Sum up all the weighted returns to get your expected portfolio returns.
Check: What were you expecting from your portfolio? Is this enough to meet your goals?
One of the aims of financial planning is to understand if the rate of return is enough for you to reach your goals and how you can change the mix of the investments in your portfolio to achieve the required rate of return.
Or, you have been taking higher risk than required and you can tone down your portfolio towards fixed income for better sleep at night?
You can now find your answer.
Note: Keep in mind that as these variables undergo change over the years, your return expectations needs to be adjusted accordingly.
This post was originally written in Feb 2017 and is now updated. Since, then returns expectation has gone down a a couple of percentage points.


Nice article. In simple words, we can assume 5% inflation adjusted returns for equity diversified portfolio. Debt funds will just match up to inflation (like gold).
Yes. Nicely put. Thank you.
I don’t think it’s true that investment returns are correlated with GDP growth: http://www.economist.com/blogs/buttonwood/2014/02/growth-and-markets
Perhaps a better way to estimate investment returns is to look at the past. The Sensex has returned 16% annualised since inception, in 1979, so adding a 1.5% dividend yield, one should expect 17%. Since past returns may not be sustained in the future, a more conservative estimate would be 12%, as you said earlier.
Yes, GDP and stock market returns may not be closely correlated. However, if GDP represents the entire set of sectors in an economy, it is perhaps, the most diversified portfolio available and hence a reasonable indicator of performance.
simple and nice article. gives clear idea on how much one can set expectations on the returns of a portfolio and modify accordingly to meet goals.Kudos vipin for the post. Eagerly waiting for the followup post 🙂
Thanks Sai. Yes, the follow up post is coming soon.
I have a different opinion. Sensex is a very very small basket of stocks and is not always representative of the GDP growth of the entire country. There have been vast deviations in the past. It also commands a premium because of all the companies of india these are the ‘top’ 30, hence the valuations are higher, which would lead to higher growth/loss in the longer term.
Crude analogy would be – Sensex is like the average IPL salary and GDP is like the average salary across all formats of cricket in india.
Interesting analogy. Not referring to sensex alone here but the overall market return.