A hidden Unovest feature
The word ‘serendipity‘ exists in the dictionary for some reason. It happened recently when a very engaged Unovest user shared this feedback.
I was always this fan of finding out (at any given point of time), what if I have to wind up entire equity PF then. And I was always keen to know, how many units have crossed 1 year (in equity) and 3 years (in Debt).
.
I found Unovest the best for this. All I have to do it is to slide the calendar in PF summary view back by a year, and bingo – I will have all the funds and the values I had exactly an year ago.
.
All I had to do is download and filter by Debt/Equity and I am done. Unovest came in very handy when I had to file the Assets and Liabilities statement recently during IT filing.
.
Since Assets are at cost, all I had to do was to slide the calendar to 31Mar2015 and I had the exact COST (IT was more interested in finding cost of assets alone) and bingo, I had the cost.
.
This slide the date feature in PF summary view is invaluable.
Yes, our user was kind enough to share it with us.
It’s a Unovest feature even we didn’t realise existed, forget it being useful.
Isn’t that awesome? More so now.
You too can use this hidden ‘Date Slide’ Unovest feature
Yes, as along as you have a Unovest account, including a free one, and have uploaded your existing portfolio, you can use this feature.
Using this Unovest feature, you can:
- View your portfolio constituents and their market value as on a past date. Not just that, you can also see the total invested value, market value and the annualised returns of the portfolio for any given date. You can use the data for any reporting (for a particular scheme or the entire portfolio) that you have to do for Income Tax or internal disclosures.
- Compare your portfolio and performance as on two different dates specially when you need to see how your portfolio composition has changed over time. You must have made changes to your portfolio in the past, applied a different investment strategy. Has that paid off? You can now see the impact using this feature.
When you make comparisons with portfolios from earlier dates, you are likely to find a direction to answer questions about your portfolio. Questions such as:
- What are your top fund holdings? Have they changed?
- What are the new funds that you have included?
- Which are the ones that have gone out of your portfolio?
- Has the overall performance improved or declined?
With this basic information available, you can then further use it to derive meaningful inferences.
Doesn’t that sound useful? So, let us dive in now.
Here’s how you can use this Unovest feature.
Let’s work with the Portfolio Summary Report as an example. It shows you – folio wise – the current holdings, the invested value, the market value, and the annualised returns.
Once you log in, just go to My Reports –> Portfolio Summary. A current date summary report will load automatically.
What you will see is the Folio wise report, you can click on the scheme wise summary.
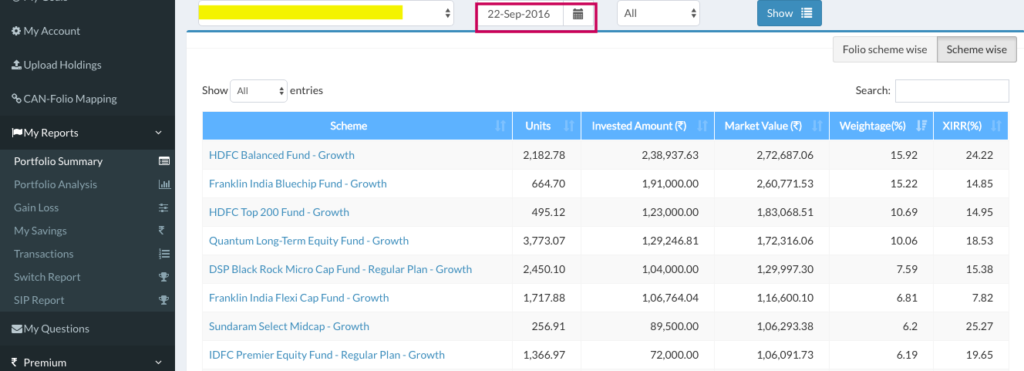
Here is one such scheme wise summary report for a random mutual fund portfolio as on current date.
You can click on any of the header rows to sort the report. Currently it is sorted on Weightage (highest to lowest).
Now, it’s time to apply the magic.
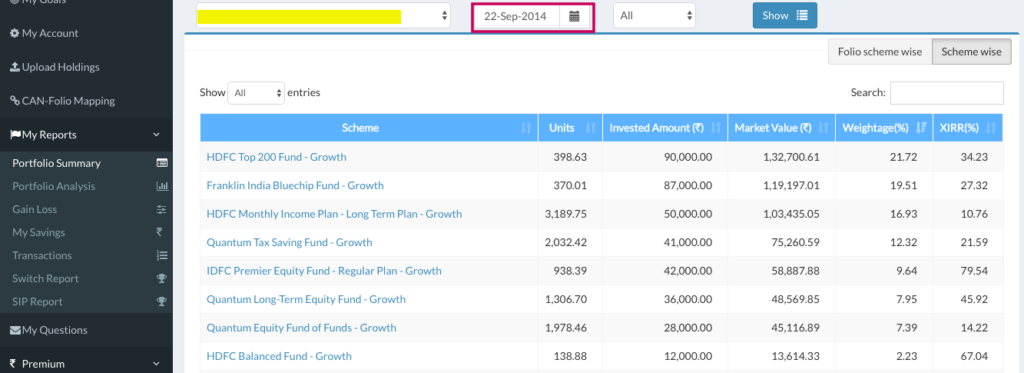
Just change the date to a previous date and press <Show>. The summary report loads for transactions that were done till the selected date.
The following is the snapshot of the same random mutual fund portfolio from 2 years before.
Do you see more possibilities emerging?
Go ahead, try it out!
Do share your feedback with us.
If you like it, go ahead and tell your friends too.
Please note: This Date Slide feature will work only if you have uploaded your mutual fund transaction history. Here’s how upload your historical transactions in just 1 click.
Disclaimer: The scheme names that appear in the snapshot images above are not recommendations. They are used only as examples.
To create your free account on Unovest, click here.


This reminds me of a problem I had understanding whether my portfolio is performing well. Its value keeps increasing, but is that because of appreciation or because I keep putting in more money?
The way to answer this would be a graph of the NAV over time. Since I have multiple funds, this would be the weighted NAV, with the weight being the value of that fund as of that date. This will separate out the increase in value caused by appreciation from that caused by additional investments.